Back to OSCAM JSF v2 New Features
OSCAM JSF v2 Post Analysis Tool - Enabling Macros
The Post Analysis Tool uses macros to enable configuration of the post analysis and perform calculation. Macros must be enabled for the tool to function. On most PCs a warning message will be displayed that gives the option to enable macros.
Macro Warning Message
If the option to enable macros is not shown then it may be necessary to change the security settings. In Excel 2007 and 2010 this is down by selecting the "File" toolbar ribbon (this is the round Microsoft Office button in Excel 2007), then selecting "Options" near the bottom of the left hand pane. Select "Trust Center" on the dialog that appears and then click on the "Trust Center Settings". Select the radio button for "Show the Message Bar in all applications when active content, such as ActiveX controls and macros, has been blocked".
Excel 2007/2010 Trust Center Settings
For Microsoft Excel 2003, select the "Tools" menu and "Options" menu item. Click the "Security" tab and select "Macro Security" button. Then select the "Macro Security Level tab. The Medium settings will enable a warning to be displayed if a workbook contains macros and then give the option to enable them.
OSCAM JSF Post Analysis Tool - Overview of Functionality
OSCAM JSF v2 uses inputs specified in US$ and provides outputs in US$. The OSCAM JSF v2 Post Analysis Tool allows a saved OSCAM results file to be loaded and for further analysis to be applied using country specific conditions. The Post Analysis Tool will convert from US$ to the local currency using a fixed or annually specified conversion rate, allows inflation categories to be defined and associated with output items, provides a "color of money" mechanism where by budget categories can be defined and output items allocated to them, and the ability to add extra cost items such as risk provision. A country specific template can be set up once so that the impacts can automatically be applied to any OSCAM results file.
The OSCAM JSF v2 Post Analysis Tool has versions for Microsoft Excel 2003 and for Microsoft Excel 2007 or 2010. The functionality of both versions is the same except that the Excel 2007/2010 version has support for the ribbon toolbar, while the Excel 2003 version uses custom toolbar buttons.
Post Analysis Tool Excel 2007/2010
Ribbon Toolbar
Post Analysis Tool Excel 2003 Custom
Toolbar
![]()
Importing an OSCAM Results File
The Import button can be used to select and load an OSCAM JSF v2 results file (this has a .CSV file extension). The "Imported" worksheet will show the results set in US$.
Post Analysis Tool - Imported
Worksheet Showing Top Level Cost Categories
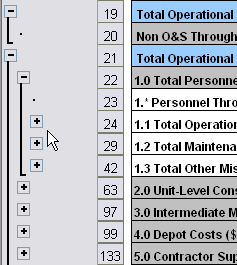
The Import worksheet and the Output worksheets uses outlining to expand the level of detail that is displayed for outputs to control of the level of detail that is displayed.
Using Outlining to Select the Level of
Detail to View
Configuring the Post Analysis
A number of post analysis options can be configured. This can be done specifically for an imported OSCAM results file, or a template spreadsheet can be set up with these options already configured so that they will automatically be applied to any results set that is imported.
Currency Settings
The "Exchange Rates" worksheet allows currency exchange rates to be defined. The currency symbol/name can be set (up to 12 characters) and a fixed or profiled exchange rate. can be selected. For the Fixed option a single exchange rate can be defined, while the Profiled option allows the exchange rate to be set for each year.
Setting the Currency Exchange Rate

Inflation Settings
OSCAM JSF v2 produces results in US$ for a specified cost year (known as Constant Year). There are options in OSCAM to convert to a cost year or generate Then Year $ (i.e. outturn/cash costs for each year) based on US inflation categories and inflation rates. The Post Analysis tool allows local inflation categories and inflation rates to be assigned for output lines which can then be used to get the results in a different cost year and in Then Years.
The "Indexation" worksheet allows the inflation index values to be re-specified for any of the standard US inflation categories and for new inflation categories to be named and populated.
Indexation Categories and Values
Corresponding tables and values also exist for Then Year categories. This is to support the US calculation of Then Years results which uses a slightly different definition for Then Years indexation compared with constant year indexation. There is an option when running the Post Analysis Tool to use the same tables for Constant Year Indexation and Then Years.
Inflation categories can then be selected on the "Imported Worksheet" for every lowest level output. The higher level outputs are calculated from the lower level outputs and so will be recalculated once inflation is applied.
Setting Inflation Categories on the
Imported sheet
Color of Money Settings
Partner countries often want results to be aggregated on a budget line basis. The Color of Money settings provide the ability to define a set of Color of Money categories and apply these to output items. The Post Analysis Tool will then calculate the costs by budget line.
The Color of Money toolbar button is used to display the Color of Money Manager dialog. This allows the set of Color of Money categories to be created and edited.
Color of Money Manager Dialog
The categories can then be selected for the lowest level output items on the "Imported" worksheet. The dropdown selection box in the Color of Money column can be used to select the appropriate category. The dropdown selection box also contains an option to view to Color of Money Manager in case a new category needs to be defined. If the cell is colored in white then it means that the output item is calculated aggregated from lower level items and so does not need a Color of Money category.
Setting Color of Money Categories on
the Imported Worksheet
Additional Costs Items
Additional cost items can be added to the "Imported" data worksheet is US$ or the local currency. They act like Throughput items in the main OSCAM JSF tool and allow costs to be specified by year and selection of the top level CAIG element (or non-O&S cost category) that they should be added to. Like other output elements, the inflation category and color of money category can be set. Toolbar buttons are used to add or remove additional cost items on the "Imported" worksheet.
Additional Cost Items on the Imported
Worksheet
![]()
When the Post Analysis Tool is run the costs will be aggregated into the Throughput Costs for the appropriate CAIG elements, and also rolled into the total cost lines. The results sheets will also show the addition cost items separately at the bottom.
Post Analysis Results
When the Post Analysis options have been configured, the tool can be run to generate the results. Three sets of results are generated automatically: Constant Year Results, Then Year Results and Color of Money Results.
Running the Post Analysis Tool
The Run button on the toolbar displays the Post Analysis Tool Control Form. This shows the Cost Base Year of the imported data and allows an alternative Cost Base Year to be selected for the outputs. The Currency can be selected as US$M or the specified local currency (in Millions). The check box allows selection of whether the Indexation tables should be used for Then Year calculations or whether a separate set of Then Year indices should be used.
Post Analysis Tool Run Dialog
Constant Year Results
The "Output" worksheet shows the Constant Year results after the Post Analysis run. The display uses the same structure as the imported data but will include any currency conversions, inflation (if the Cost Base Year is different to the imported data) and Additional Data items will be rolled into the appropriate Throughput lines.
Output Worksheet Showing Constant Year
Results
Then Year Results
The "TY Output" worksheet shows the Then Year results after the Post Analysis run. The display uses the same structure as the imported data but will include any currency conversions, Then Year inflation and Additional Data items will be rolled into the appropriate Throughput lines.
Color of Money Results
The "Color of Money" worksheet shows the costs by budget line in both Constant Year and Then Year categories. Any Additional Cost lines will be included in these costs. Any defined Color of Money categories that have zero costs will automatically be excluded from the results table.
Color of Money Worksheet