Back to OSCAM JSF v2 New Features
The Results Screen
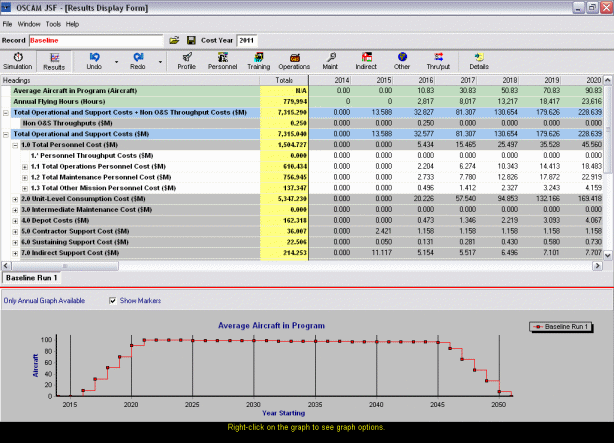
The Results Screen has undergone minor updates to the cost and non-cost breakdown structure. The name tabs now have right-click functionality to allow quick access functions for that results set.
The basic functionality of the results screen has stayed the same as in OSCAM JSF v1. Some of the output lines have changed in cases where OSCAM JSF v2 allows more granularity, but the basic structure has remained the same. Additional output lines have been added to account for an enhancement in the Throughput sector, allowing Throughput costs to be allocated to a particular element in the output tree. The 1st level results can now be viewed as a pie-chart via a right-click option.
The results tabs at the bottom of the results table now display a popup menu when right-clicking the mouse on them. This allows quick access to view/change the results description, delete a results set, reload the dataset that was used to generate the results, and to specify whether or not that results set is displayed on the graph.
The ability to re-load the input data that generated the results set as a right-click option avoids the need to use the Load Wizard to retrieve input data. Input data records now contain a date stamp which is used to check whether the input data has been changed and saved since the results were generated. If this is the case then a warning message will be displayed but there is still the option to re-load the data. If a results set was generated from unsaved input data then the re-load input data option will not be available.
The Results Display

View a demonstration of the Results Output
If you have Flash installed you can View the Tutorial (opens in new window).If you do not have Flash installed you can Download the Tutorial and play the .exe file.